

Forex drawdown measures how far an account’s value has fallen from an earlier high. It gives returns useful context, but it cannot predict future losses or guarantee that a strategy is safe.
I use drawdown as a way to examine historical risk alongside the trading record, not as a stand-alone verdict. This is educational information, not personal financial advice. The starting point is understanding which account values go into the calculation.
Key Takeaways
- Drawdown measures a fall from an earlier account-value peak to a later low, expressed as an amount or percentage.
- Maximum drawdown is the deepest observed fall during a stated period. It does not establish the worst loss that could happen.
- Equity includes open profits and losses, whilst balance generally reflects closed results and cash movements.
- Deposits, withdrawals and measurement frequency can make apparently similar figures difficult to compare.
- A 20% loss requires a 25% gain on the remaining capital to recover the previous value.
Forex Drawdown Explained: How to Measure Peak-to-Trough Losses
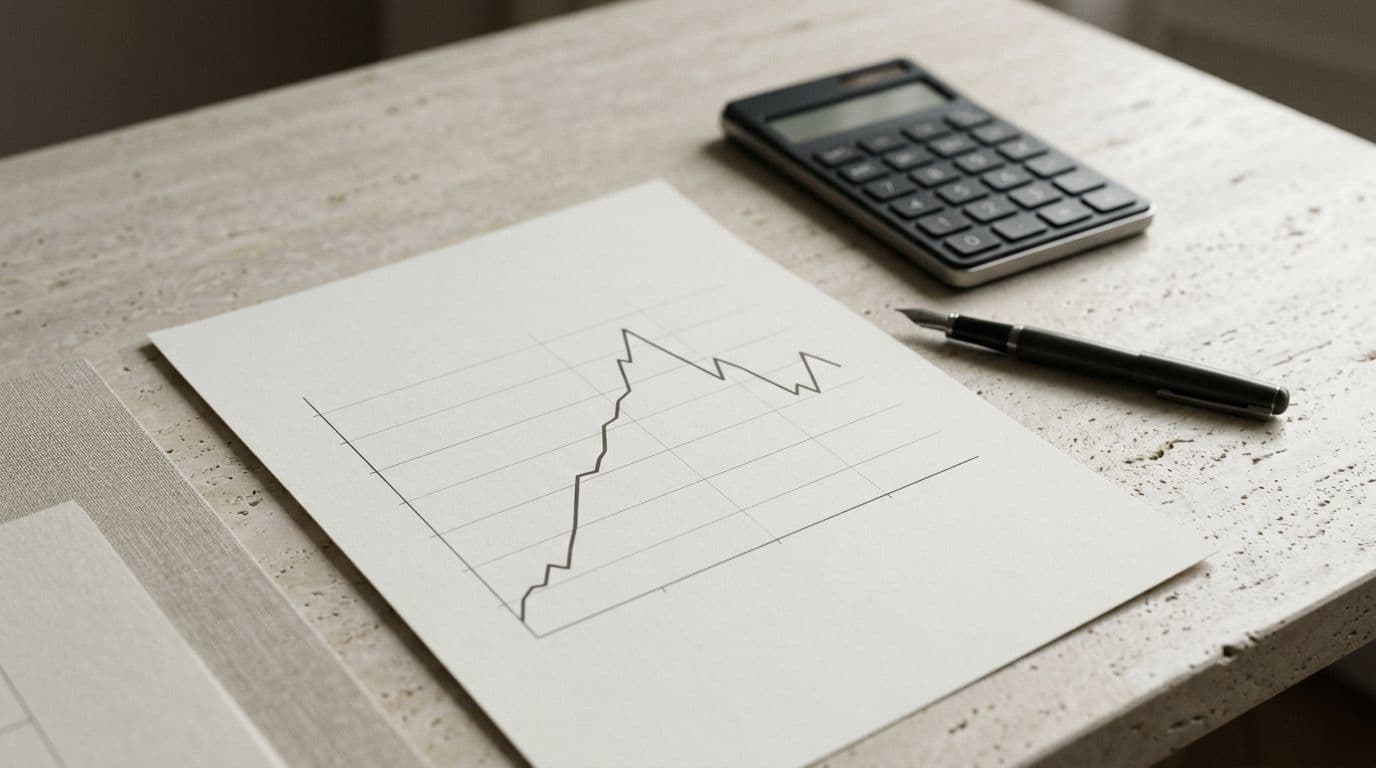
A drawdown compares an account’s value at a high point with a subsequent lower value. To express the fall as a percentage, subtract the trough from the peak, divide by the peak, then multiply by 100.
The trough must come after the peak. A low point that occurred before a later high cannot be used as that high’s drawdown. Equally, a maximum figure covers only the observations included in the selected period.
Calculate drawdown with a simple account example
Suppose an account’s equity rises to £12,000, then falls to £10,200. The difference is £1,800.
£1,800 / £12,000 x 100 = 15% drawdown
This is an illustrative example, with no deposits or withdrawals during the decline. The £12,000 peak is the denominator, even if the account originally started with a different amount. If the equity later reaches a new high, a subsequent drawdown can be measured against that new peak.
A report may show the decline as a positive 15% loss or as a negative 15% change. Both can describe the same movement, provided the sign convention is clear. The dates matter too: the figure should identify the period over which the account values were observed.
Understand absolute, relative and maximum drawdown
Absolute drawdown commonly describes a fall below the starting balance or initial deposit. Relative drawdown usually expresses a decline from a peak as a percentage. Maximum drawdown is the deepest peak-to-subsequent-trough fall recorded within the chosen period.
These labels aren’t applied identically everywhere. One report may emphasise the largest cash fall, whilst another highlights the largest percentage fall. Those need not occur during the same decline.
I would give more weight to a stated formula and baseline than to a label alone. A useful report identifies the account-value series, the dates covered and whether the figure is a cash amount or a percentage. Without those details, two headline figures may describe different things.
Choose balance or equity to measure forex drawdown
Balance generally includes realised trading results and cash movements, such as deposits and withdrawals. Equity also reflects unrealised gains and losses on positions that remain open.
That distinction changes what a drawdown can reveal. A balance curve can look stable whilst an open position is losing value. An equity curve can show the decline before the position closes, although the figure may change again as prices move.

Why open losses and leverage affect the picture
Closed-trade statistics leave out the current effect of trades that haven’t yet exited. A strategy can report profitable closed positions whilst carrying substantial unrealised losses elsewhere in the account.
Leverage increases exposure relative to the money committed as margin. As a result, a price movement can have a much larger effect on account equity than the movement’s percentage suggests. Several open positions may also react to the same currency or economic event, rather than behaving as independent risks.
An ordinary stop-loss order doesn’t guarantee the requested exit price. Fast markets, gaps and limited liquidity can lead to an adverse fill. The UK’s Financial Conduct Authority discussed such risks in its consultation on retail CFD products.
I would read drawdown alongside total open exposure and available margin. Our guide to forex margin and account equity explains how losses can affect the funds supporting open trades.
Account for cash flows and measurement intervals
Deposits can raise an account’s value without a trading gain. Withdrawals can lower it without a trading loss. An unadjusted account-value curve can therefore show a misleading peak or decline if cash movements aren’t identified.
Sampling frequency also matters. A report based on end-of-day values may miss an intraday equity low that a more frequent series captures. Neither number is meaningful for comparison unless you know what each one measures.
For a like-for-like assessment, compare the same period, currency and balance or equity basis. Also look for an explanation of how the calculation handles deposits, withdrawals and values between observations. A missing methodology limits what the percentage can tell you.
Use drawdown to judge risk, not just past returns
A profitable record can contain a substantial decline along the way. Drawdown shows part of that path, helping you assess the losses that accompanied the reported return.
I would read the figure alongside the length of the record, the positions taken and any changes to the strategy. A short history may cover favourable conditions but miss periods of severe volatility. Even a longer record cannot establish how the strategy will behave next.
Read the record behind a performance claim
A displayed return may leave important questions unanswered. It should be clear whether the record is live or simulated, whether open positions are included and whether the result accounts for trading costs.
Spreads, commissions and overnight financing can reduce returns. Slippage, the difference between an expected price and the actual execution price, can also change an outcome. A backtest depends on assumptions about those costs and fills; settings fitted too closely to historical data may not perform as well under different conditions.
A strategy provider’s return isn’t a promised result for followers. Entry times, position sizes, charges and execution can differ between accounts. The International Organization of Securities Commissions has examined risks in its report on retail leveraged products.
For the same reason, I would consider concentration alongside the headline return. Our explanation of forex pair correlation and exposure covers why several positions can share a risk.
See why a large loss takes more to recover
A 20% fall leaves 80% of the original capital. To return to the earlier peak, the account needs a 25% gain on what remains.
For example, £10,000 falling by 20% leaves £8,000. Recovering the £2,000 difference requires a 25% gain on £8,000. A gain of 20% would add £1,600, leaving the account below its previous high.
The larger the loss, the greater the percentage gain needed on the remaining capital. This is arithmetic, not a forecast or a trading target. It also doesn’t account for additional charges or subsequent losses.
Past performance doesn’t predict future returns. A historical maximum drawdown can help you understand a recorded loss, but it cannot promise that a future decline will stay within the same boundary.
Frequently Asked Questions
Is drawdown the same as a loss from the initial deposit?
Not necessarily. Drawdown generally compares a later low with a previous peak, which may be higher than the starting deposit. A measure based on the initial balance uses a different reference point and can produce a different figure.
Can maximum drawdown show the worst loss a strategy may face?
No. It identifies the largest decline observed in the history and period measured, not the maximum possible future loss. A short record may not include severe market conditions or reveal how a changed strategy will behave.
Why do two platforms report different drawdowns?
They may use balance or equity, sample values at different intervals or cover different dates. Cash-flow treatment and the meanings attached to calculation labels can differ too. I would compare the inputs and formula before treating the percentages as equivalent.
Are daily drawdown limits the same as maximum drawdown?
They can use different reference points and time periods. A daily limit may reset at a stated time, whilst another limit may use an initial balance or a moving peak. The applicable rule depends on the account or programme, and a breach can occur while a losing position remains open.
Do demo and live accounts show the same drawdown?
They need not. A demo can illustrate how a platform displays account changes, but simulated execution may not reproduce live spreads, slippage or liquidity. The two records also reflect only the trades and conditions included in each account.
Put the Figure in Context
To measure forex drawdown, identify the account-value peak and the later trough. Divide the fall by the peak, then state the period and whether the values use balance or equity.
I treat the result as evidence about a recorded decline, not a limit on what can happen. Used alongside open exposure and trading costs, it gives a clearer view of historical risk without removing the risk of future loss.